Design and create dashboards that give you an overview of the activities recorded in Iristrace.
The Iristrace dashboard is a tool that allows us to provide a graphical representation of much of the data collected through Iristrace.
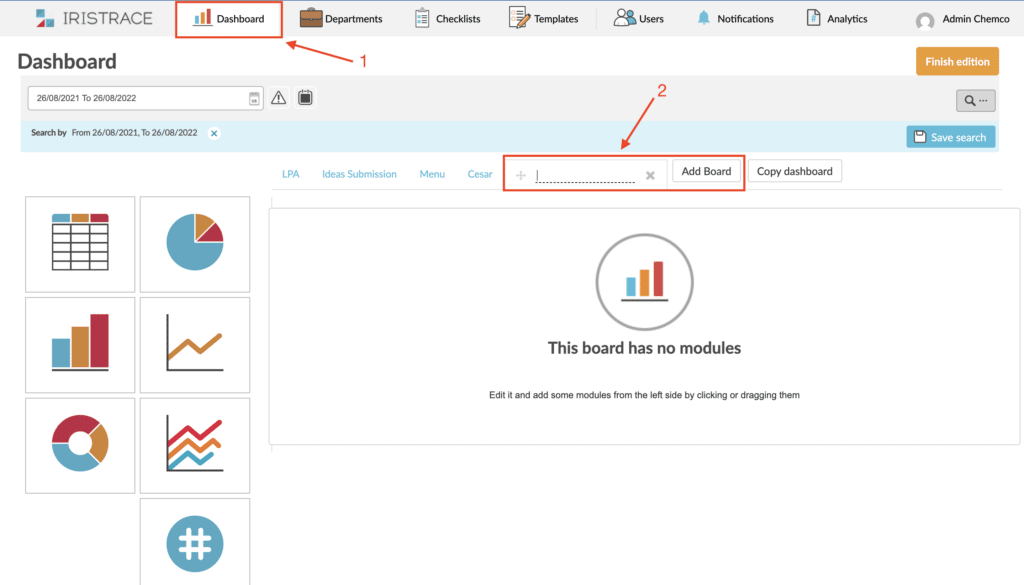
1. Go to the “Dashboard” tab and create a new dashboard. #
In this section we can create as many Panels as we want, in case we don’t have any panel created we can add one indicating the name and pressing the button ‘Add Panel’.
2. Select the chart type #
Once the dashboard is created you can select what type of graph you want to add to your dashboard. You can select between tables, bar graphs, multibars, linear, pie.
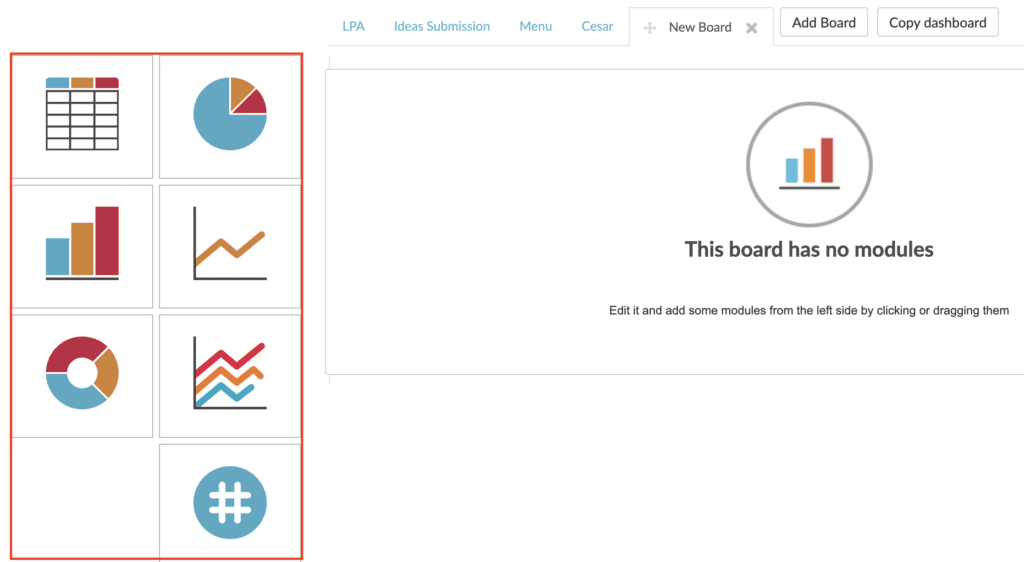
Once the module has been selected, the configuration option will appear and you will be able to select on which data you want the module to show you information. Then click on the module configuration button.
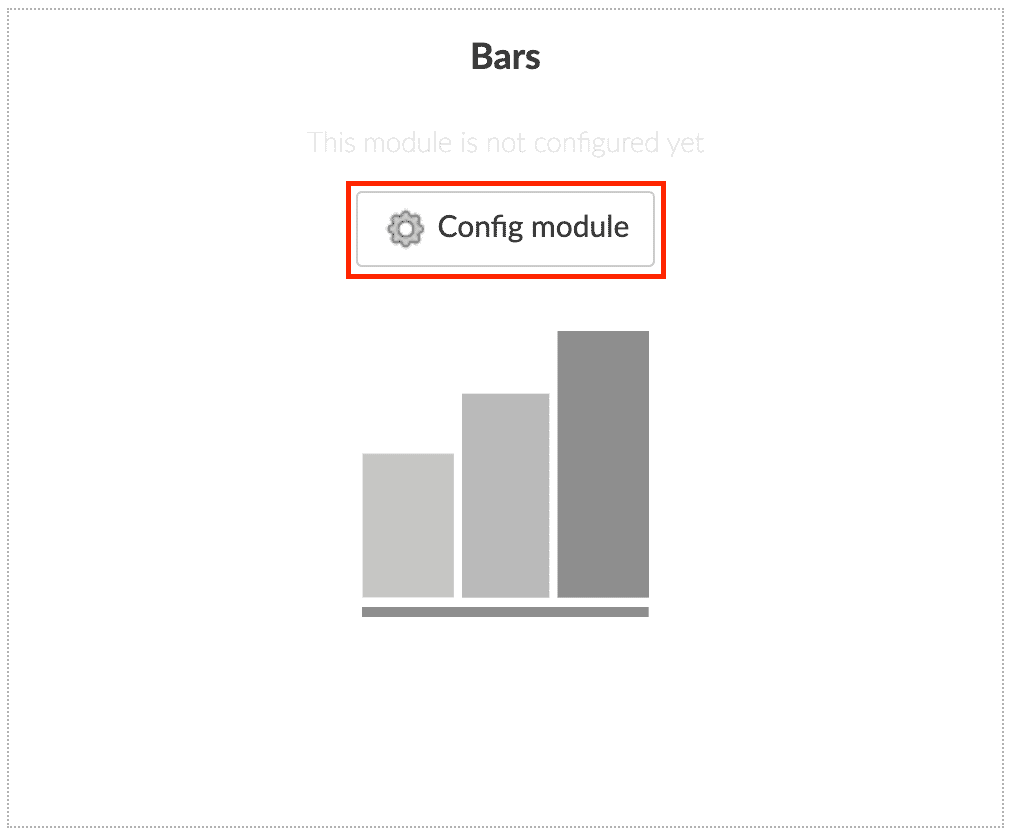
3. Determine the data you want to represent #
When you click on Configure module the following window will appear in which in 4 steps you will be able to determine which aspects will be part of the module and which data will be analysed in the module.
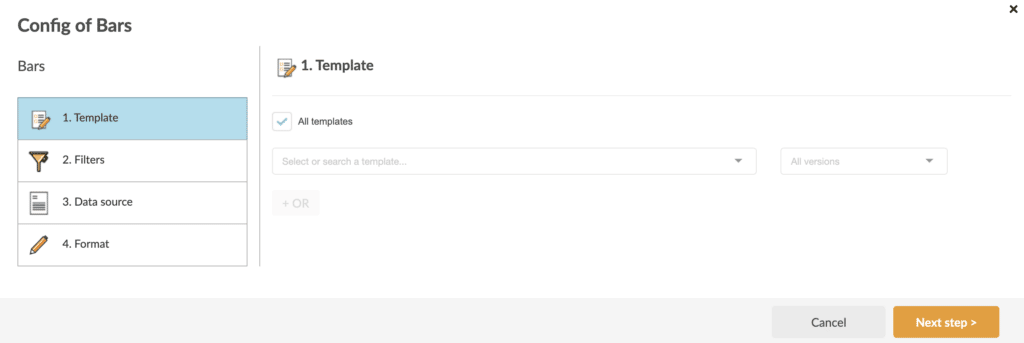
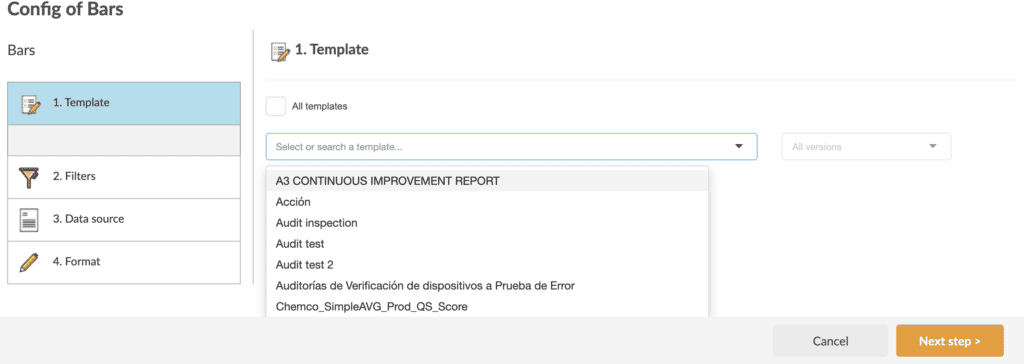
3.1. Template #
On which Template to select the data. It can be a specific template, all or some of them through the “OR” option:
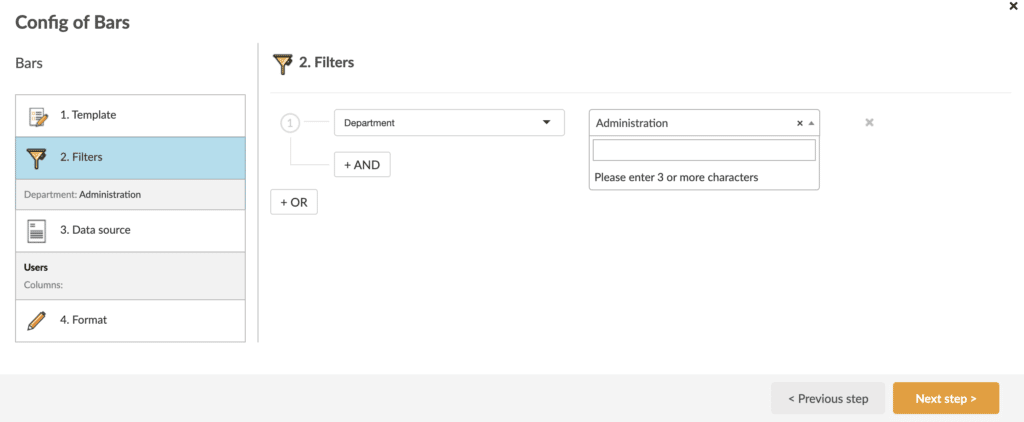
3.2. Filters #
Specific filters in relation to departments, users, labels… created in Iristrace:
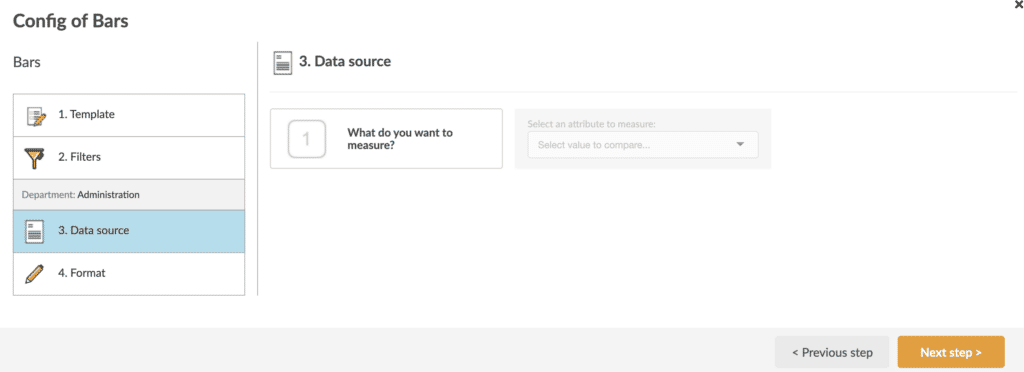
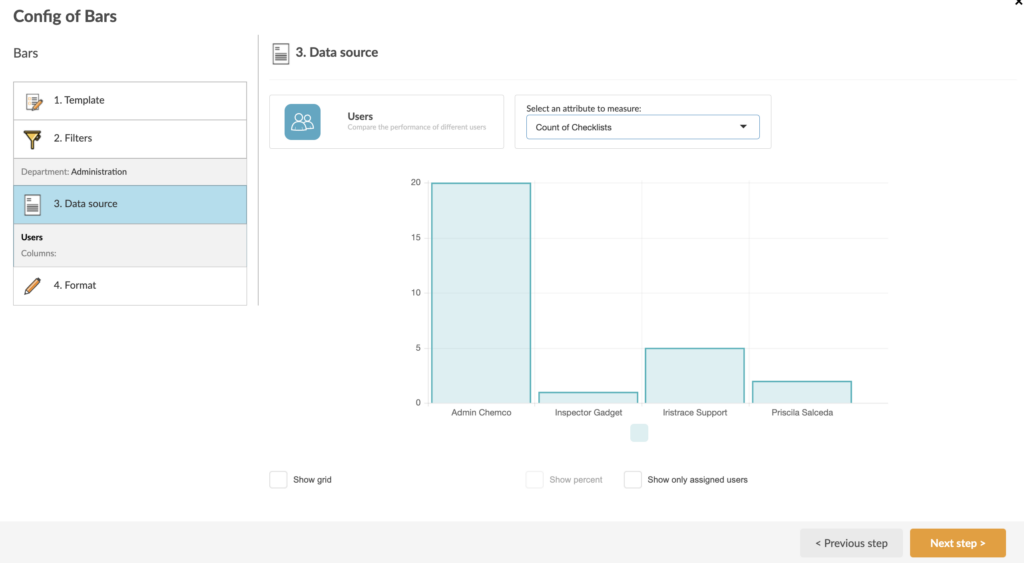
3.3. Data source #
The third step is to select the source of the data; here you will determine what you want to measure.
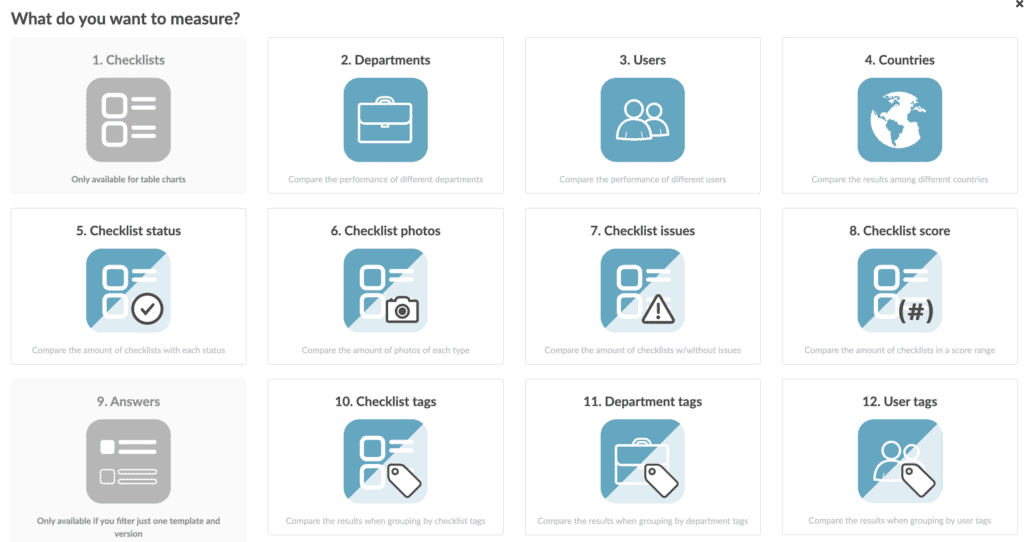
First, it will ask what you want to measure and by clicking on the question twelve options will appear to select the one you want.
It should be noted that some options will only be available for specific charts such as checklist or answers will only be available for table models or by performing a filter.
Next you must select which Iristrace data you want to select.
Finally select the attribute of the selected data type, you can see a preview of the result.
3.4. Format #
The last step of the configuration is to customize the graphic by selecting the color to represent according to the type of graphic chosen. We can also switch between different types of graphics.
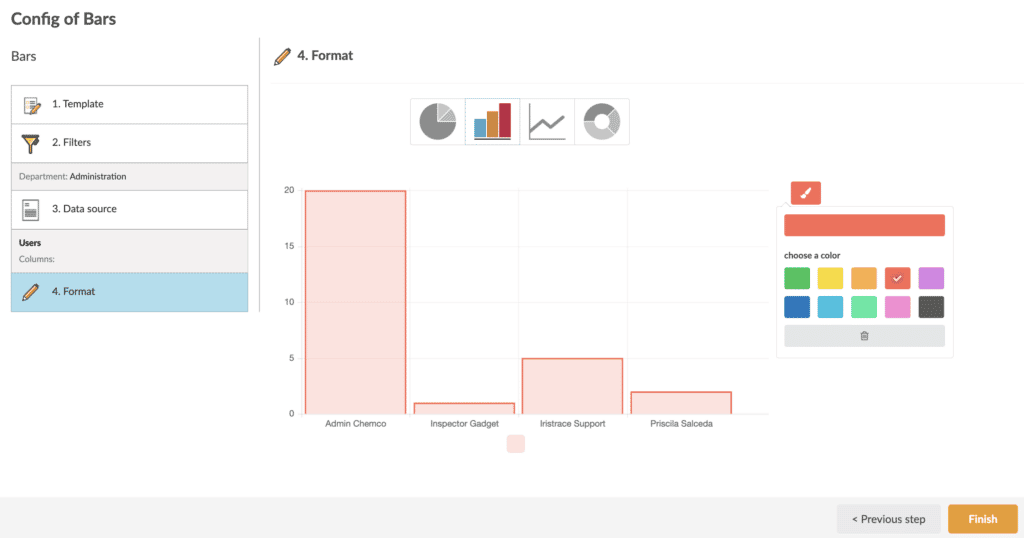
Click the finish button to end the module.
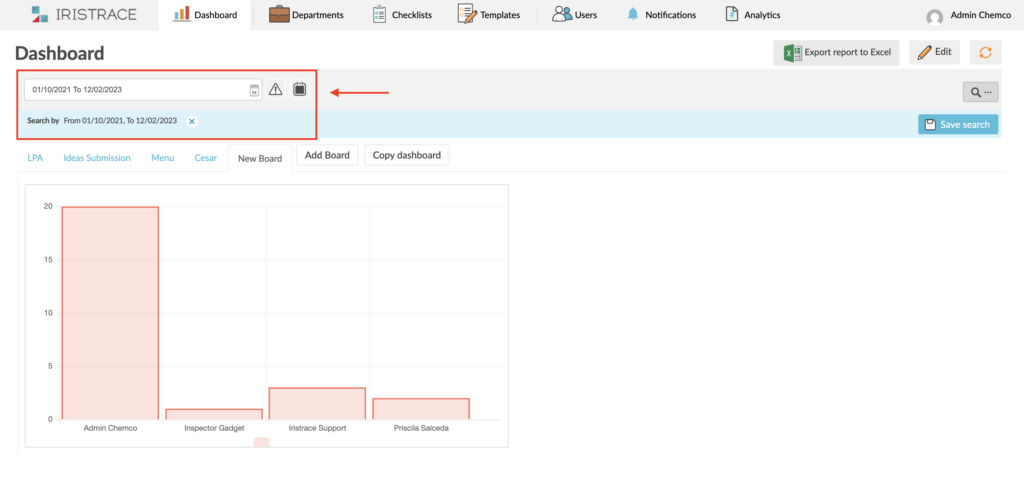
We can also use the range of dates to know what has happened in past months or on the contrary to know in real time what is happening in our business.
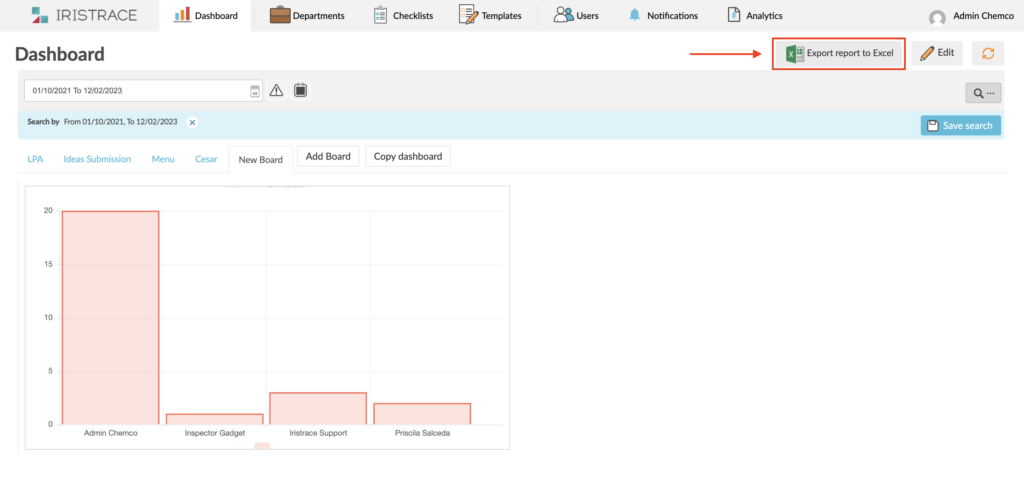
Download data in Excel format #
On the other hand, if we want to continue investigating and getting the most out of the data collected by Iristrace, we can download the Dashboard data in Excel.
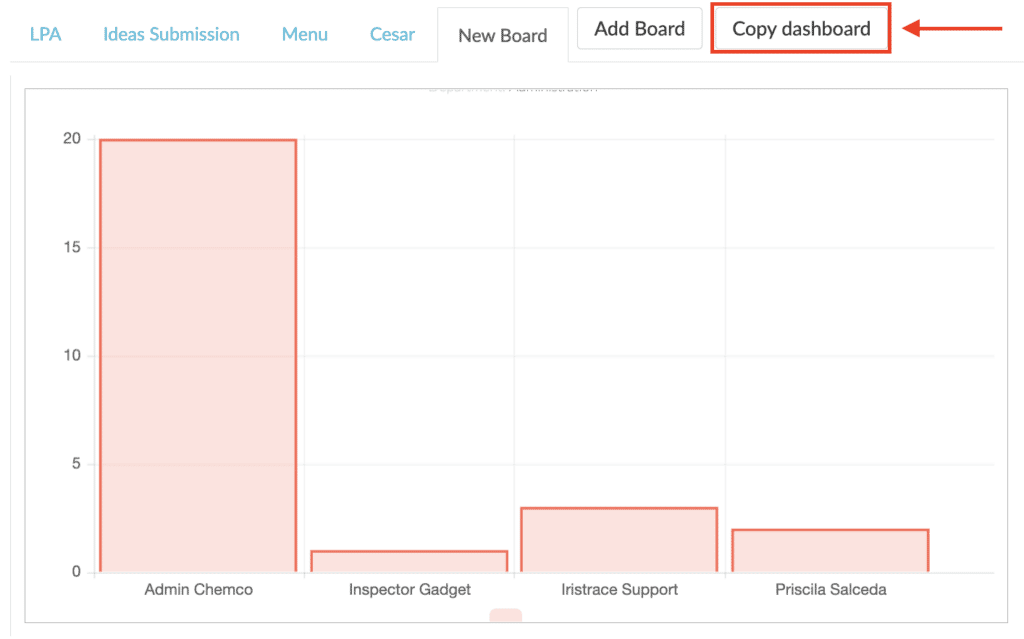
Copy Dashboard tabs #
Once you have your dashboard created, you can copy the tabs you need in the dashboards of other users (only available for administrator users).
To copy one or more tabs, select them from ‘Copy dashboards’ and click ‘Copy’, a new window will open with the list of users so you can choose them.